

Customer bursts were exposing a weakness in our serving stack that average traffic mostly hid. We could process the workload, but we had to carry too much spare GPU capacity just to stay ahead of spikes. At first, that looked like a straightforward capacity problem.
Reducto turns documents into structured data. Before we can extract fields, we run several CV models to understand each page: text regions, tables, checkboxes, equations, reading order, and other layout signals. This happens early in the pipeline, so when it slows down, everything after it slows down too.
For a while, we ran that workload on A10Gs. Most of the models in this part of the stack are small. One representative detection model is under 10M parameters. That made A10Gs look like a sensible fit.
Then we looked more closely at the hardware. GPU utilization usually sat in the 2-5% range.
That changed the question. If the GPUs were mostly idle, why were bursts forcing us to provision so much headroom?
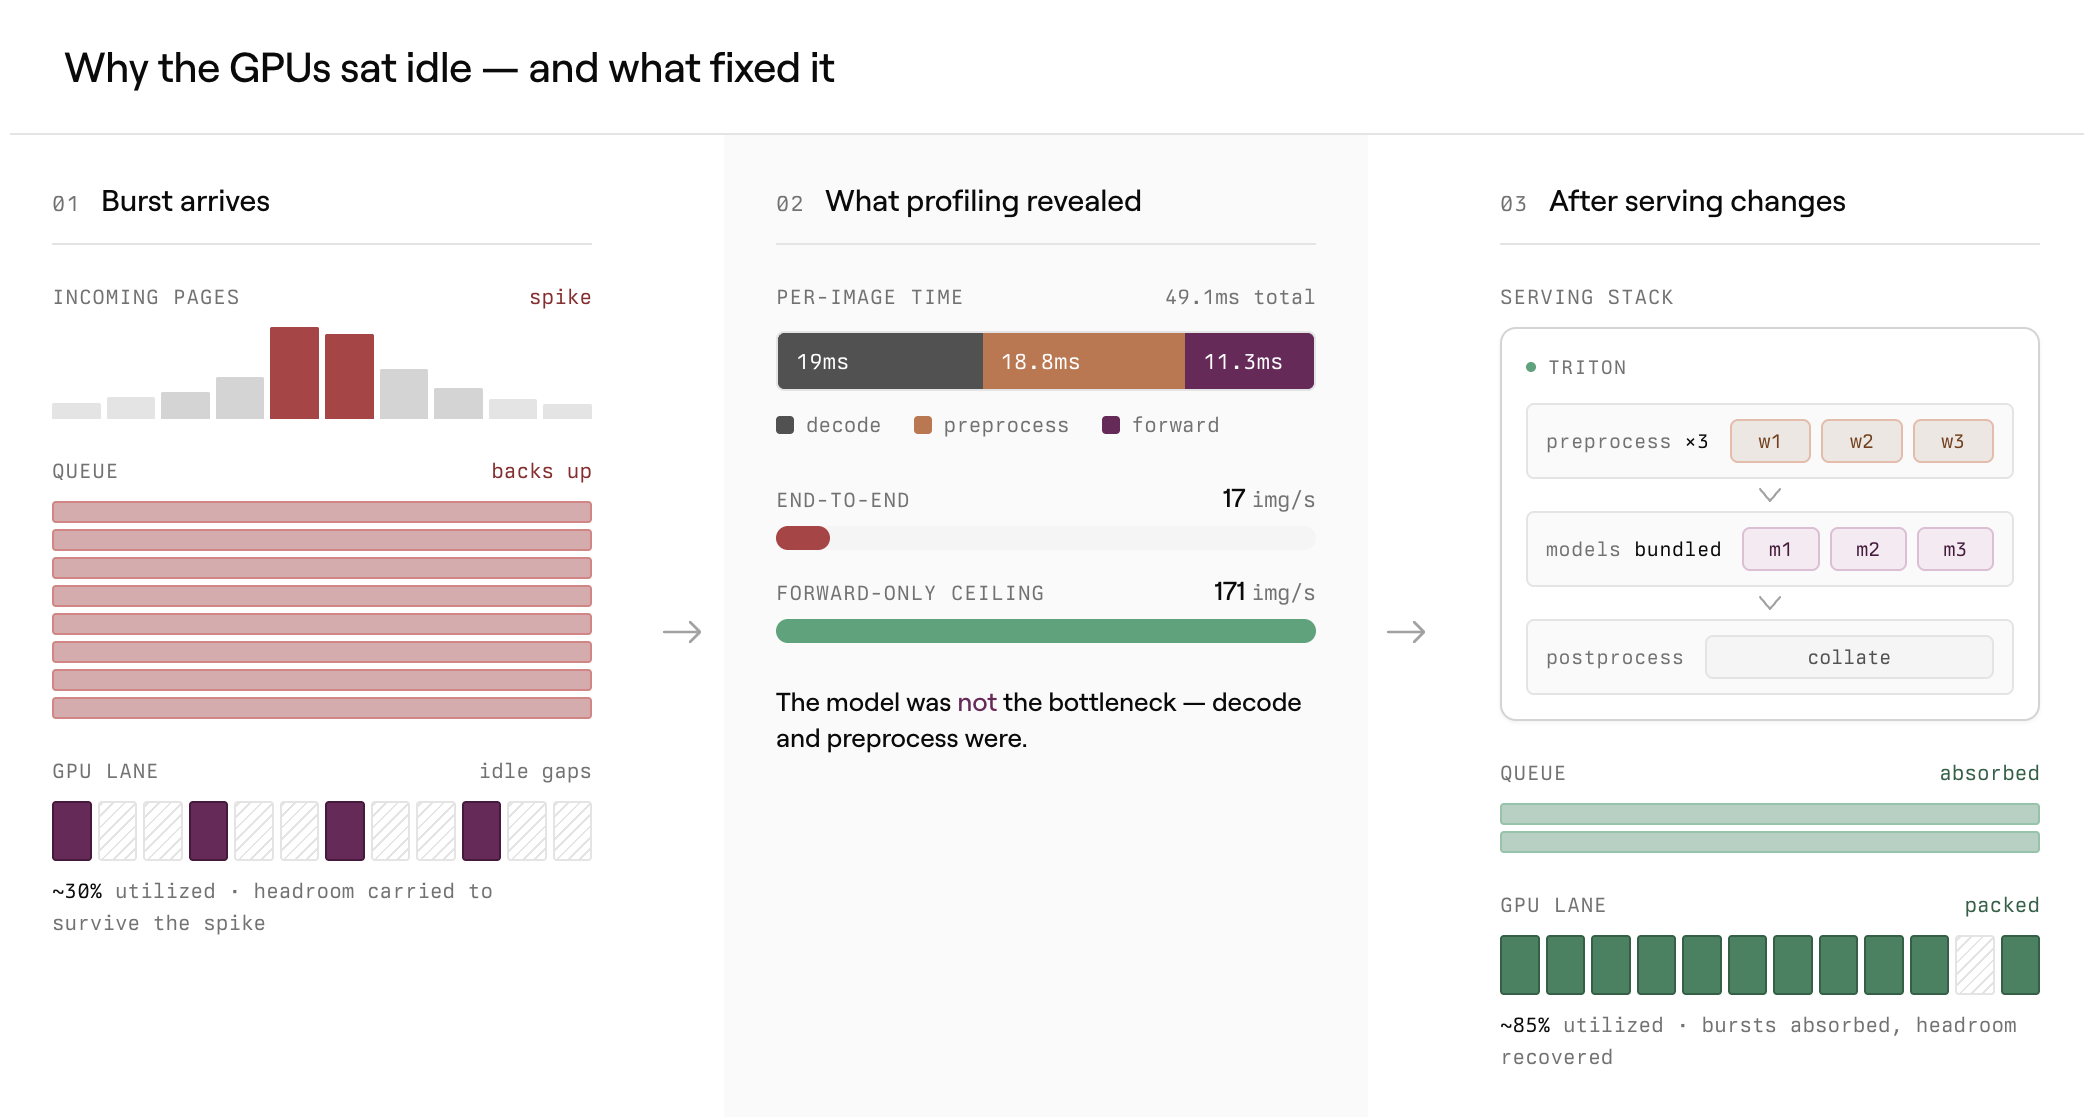
The numbers below focus on one representative detection model, but the same pattern showed up elsewhere in the stack.
Start with the whole pipeline
The path looked like this:
IMAGE_BYTES -> preprocess -> forward -> postprocess -> DETECTIONSThe baseline stack used ONNX Runtime. Each GPU worker loaded one copy of the model and handled a limited amount of work at a time. End to end, it ran at about 17 images per second, and the GPU spent most of its time idle.
We started by measuring the pipeline end to end. We wanted to know where the time actually went.
Profiling showed why:

The forward pass was not the main issue. We were spending more time decoding and preparing images than running the model.
To check that, we measured the model in isolation with preprocessed images. A single H100 could push 171 images per second on the forward call alone. That gave us a ceiling.
That was the first turn in the project. The model was not the reason we were stuck at 17 img/s in production. The rest of the pipeline was.
First win: fix preprocessing
We started by parallelizing preprocessing on the CPU with a worker pool.
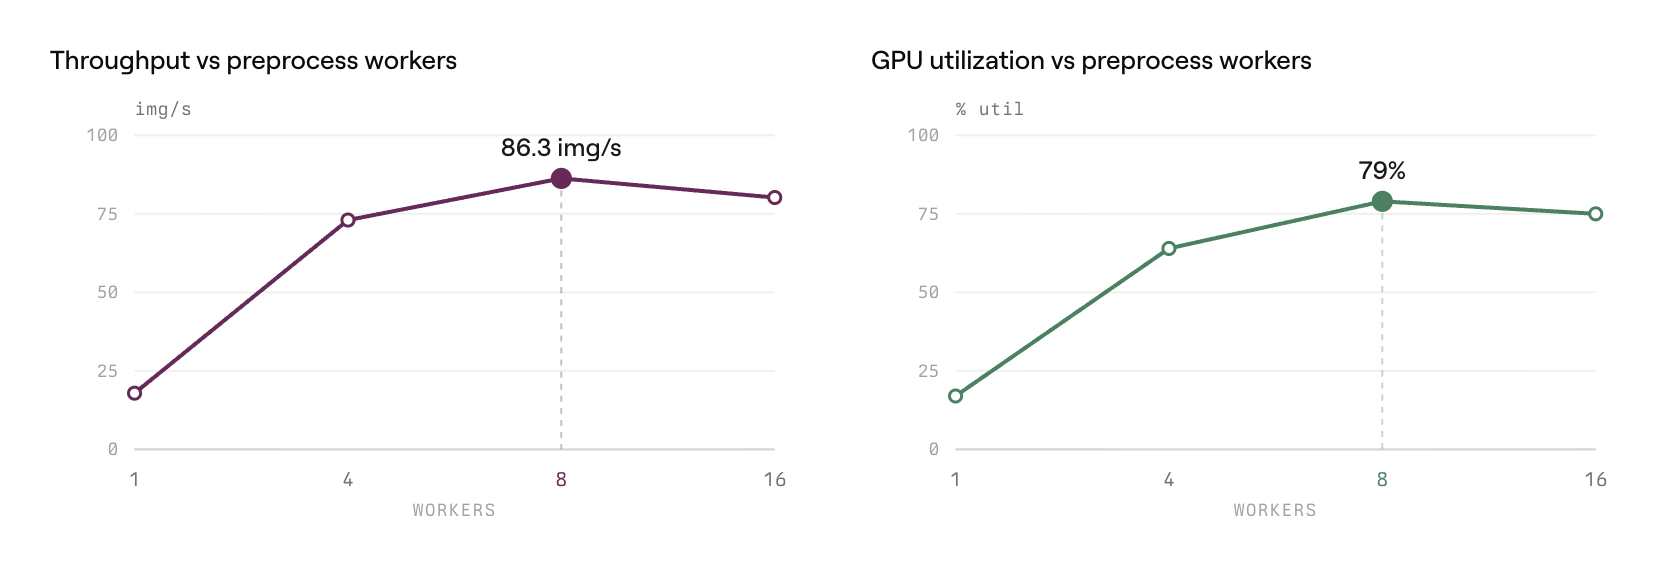
Eight workers was the best point. Throughput rose to 86.3 img/s and median GPU utilization reached 79%.
At that point the problem was clear. The system was not limited by model compute. It was limited by the pipeline around the model.
For a moment, this looked like it might be enough. It was a big jump for a single model, and it confirmed that the first bottleneck was outside the model.
It still did not solve the broader serving problem. We were running many models, traffic was bursty, and we still did not have enough control over how work was scheduled across the hardware.
Then change the serving stack
The next step was to change how we served the models. For the model in this post, we rebuilt the path in Triton with separate preprocess, forward, and postprocess stages, and we swapped the ONNX Runtime backend for TensorRT. TensorRT is NVIDIA’s SDK for optimizing deep-learning inference on NVIDIA GPUs, so we expect a larger win.
Triton gave us more control over batching, concurrency, and scheduling. TensorRT let us push GPU inference harder.
The first pass did not help much:
| Engine | Throughput | p95 latency |
|---|---|---|
| Triton + ONNX Runtime | 32.0 img/s | 48.0 ms |
| Triton + TensorRT FP32 | 34.0 img/s | 39.8 ms |
That was the second turn in the project. Changing the serving stack was not enough by itself. We still were not keeping enough work in flight.
Tuning Triton
We first varied the number of TensorRT contexts to see where throughput leveled off. Here, a context is roughly one execution slot for the model. More contexts let the same GPU keep more work active at once. Testing revealed three contexts worked best for this model. We then scaled the Triton preprocessing stage by running more preprocess workers inside Triton.
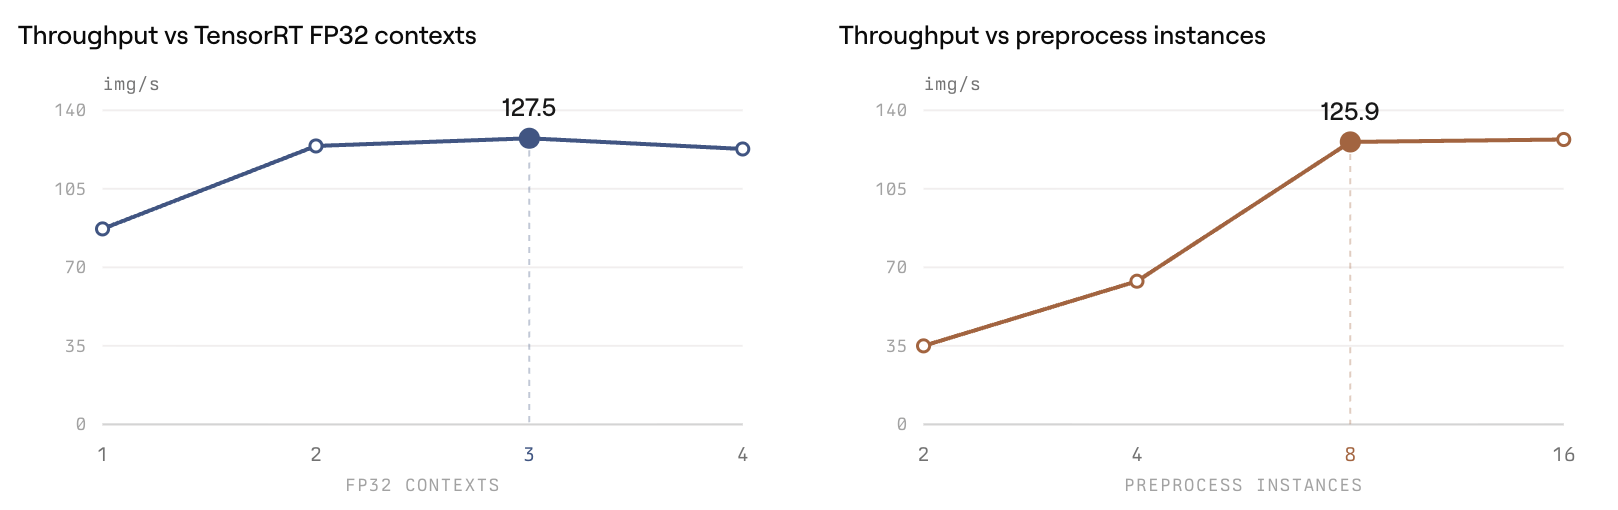
This tuning got us much closer to the theoretical ceiling we had measured earlier.
Another setting helped too. Switching Triton’s execution policy to BLOCKING reduced host-side scheduling overhead in our setup and kept the model instances busier. Peak throughput increased from 133.1 img/s to 148.5 img/s. At concurrency 28, p50 latency dropped from 202 ms to 179 ms.
That got the single-model path into much better shape. The broader lesson was that we needed to think about serving as a shared system, not as a set of isolated small-model deployments.
Across the broader pipeline, that pushed us toward bundling many models into one Triton server on newer, larger GPUs. That gave the hardware a steadier stream of work, let us pack more models together, and improved price/performance as a side effect.
What changed in production
In production, this work let us:
- handle burstier traffic without treating GPU provisioning as the first constraint
- pack more models into the same serving stack
- raise GPU utilization from 2-5% to 40-90%
- keep far less excess capacity sitting idle
The effect was most obvious on large customer spikes. Before this work, bursts pushed us toward overprovisioning. After it, the system had much more room to absorb demand with the hardware already in service.
Low GPU utilization often points to a systems problem, not a model problem. Decode, preprocess, scheduling, and serving architecture can matter as much as model speed.
Measuring the forward-only ceiling helped too. It gave us a concrete target and kept us from guessing.
If you serve CV models at scale, it is worth checking whether GPU compute is actually the bottleneck. In our case, it was not. The constraint was the work around the model, and fixing that made capacity planning much easier.
This post is one slice of what the ML Infra team works on. We’re also pushing on VLM inference and building out our training stack. If squeezing performance out of GPUs and designing serving systems sounds fun, we’re hiring.